Make the Annual Report More Engaging with Tables, Figures, and Infographics


Turn complex data into clear, compelling visuals that capture your audience’s attention
Money
Money
6 min
Discover how to transform your annual report from a dense document into an engaging communication tool. Learn how tables, figures, and infographics can highlight key insights, enhance transparency, and make your organization’s story more memorable.
Jacob Morris
Jacob
Morris

Make the Annual Report More Engaging with Tables, Figures, and Infographics

Turn complex data into clear, compelling visuals that capture your audience’s attention
Money
Money
6 min
Discover how to transform your annual report from a dense document into an engaging communication tool. Learn how tables, figures, and infographics can highlight key insights, enhance transparency, and make your organization’s story more memorable.
Jacob Morris
Jacob
Morris

An annual report is more than a financial statement—it’s a story about your organization’s performance, values, and direction. In Canada, where transparency and accountability are key expectations from investors, employees, and the public, a well-designed report can strengthen trust and engagement. Yet, many annual reports still end up as dense blocks of text, where important insights get lost in jargon and numbers. By using tables, figures, and infographics strategically, you can make your report more engaging—without compromising accuracy or professionalism.

From Text to Visual Storytelling

People process and remember information better when it’s presented visually. A well-crafted chart can communicate in seconds what might otherwise take paragraphs to explain. Think about how you can turn your key messages into visual elements:

  • Tables provide structure and make it easy to compare data across years or departments.
  • Figures—such as bar and line charts—illustrate trends and changes over time.
  • Infographics combine text, numbers, and visuals into a narrative that captures attention and builds understanding.

When planning your report, think in visual chapters: which sections are best told through text, and where could a visual make your point clearer?

Tables: Structure and Comparability

Tables are the backbone of any annual report. They bring order to complex data and allow readers to compare key metrics across periods. But a table doesn’t have to be dull. With a few design choices, you can make it more readable and appealing:

  • Use shading or colour accents to highlight totals or significant changes.
  • Add small icons or arrows to indicate increases or decreases.
  • Maintain consistent formatting—same decimal places, fonts, and alignments.

A good table should be understandable on its own. Consider adding a short headline that tells readers what to notice—such as “Revenue grew 10% in 2023 despite higher supply costs.”

Figures: Bring the Data to Life

Figures are ideal for showing movement and relationships. A line chart can illustrate growth over time, while a bar chart can compare performance across divisions or regions. When choosing a chart type, ask yourself: what do I want the reader to see?

  • Use line charts to show trends over time.
  • Use bar charts to compare categories or business units.
  • Use pie charts sparingly—they work best when there are only a few categories.

Avoid cluttering your visuals with too many colours or data points. A simple, focused figure with one clear message is far more effective than a complex one that overwhelms the reader.

Infographics: Tell the Story Behind the Numbers

Infographics are especially useful for communicating complex ideas in a clear and engaging way. They can show how your organization creates value, how sustainability initiatives impact results, or how employee engagement connects to productivity. A strong infographic combines data, text, and design into a cohesive story. It’s not just decoration—it’s a tool for understanding. Consider placing an infographic at the beginning of your report to summarize the year’s highlights. This gives readers a quick overview before they dive into the details.

Design and Consistency

Even the best visuals lose impact if they don’t align with your organization’s visual identity. Ensure that colours, fonts, and layouts follow your brand guidelines. Use a consistent colour system—for example, one colour for financial data, another for environmental performance, and a third for community impact. This makes the report easier to navigate and more professional.

Accessibility is also essential. Choose colour contrasts that are readable for everyone, and include text descriptions for charts and figures so the report works well in digital formats and with screen readers.

From Report to Communication Tool

A modern annual report is not just a compliance document—it’s a communication tool. By using tables, figures, and infographics thoughtfully, you can present your organization’s results, strategy, and values in a way that informs and inspires.

It’s not about making the report “prettier,” but about making it clearer, more credible, and more engaging. A visually strong annual report shows that your organization values transparency and effective communication as much as it values performance—and that can make all the difference in how it’s perceived by stakeholders across Canada.

Learn from the Past: Strategic Economic Decisions as a Driver of Future Growth
How historical insights can shape smarter economic strategies for tomorrow
Money
Money
Economic Strategy
Sustainable Growth
Policy Insights
Canadian Economy
Future Planning
5 min
By examining past economic decisions, Canada can uncover valuable lessons to guide future growth. This article explores how strategic thinking, resilience, and innovation can turn historical experience into a roadmap for long-term prosperity.
Claire Powell
Claire
Powell
Talking About Finance: Internal Communication That Strengthens Understanding of the Company’s Funding
Turn financial communication into a shared language that connects every part of the business
Money
Money
Internal Communication
Finance
Employee Engagement
Leadership
Organizational Culture
6 min
Finance doesn’t have to be a mystery reserved for executives. This article shows how open, clear internal communication about funding and financial decisions can strengthen understanding, engagement, and trust across the organization—helping everyone see how their work contributes to the company’s financial health.
Oliver Kelly
Oliver
Kelly
Budgeting with Purpose: How Management’s Approach Shapes Employee Engagement and Sense of Responsibility
Discover how a purpose-driven approach to budgeting can boost motivation and strengthen workplace culture
Money
Money
Budgeting
Leadership
Employee Engagement
Workplace Culture
Management Strategy
6 min
Budgeting is more than just managing numbers—it’s a leadership tool that can inspire engagement and accountability. Learn how shifting from control to collaboration in the budgeting process helps employees feel more connected, responsible, and motivated to achieve shared goals.
Ethan Cooper
Ethan
Cooper
An overview of meeting tables in many varieties
Create the best framework for collaboration and productivity with the right meeting table
Companies
Companies
Meeting tables
Office interior
Work environment
Office furniture
Collaboration
7 min
Meeting tables come in many sizes, shapes and materials. In this article, you’ll get a comprehensive overview of what to consider when choosing a meeting table, and which types and brands are worth knowing about.
Owen Rodriguez
Owen
Rodriguez
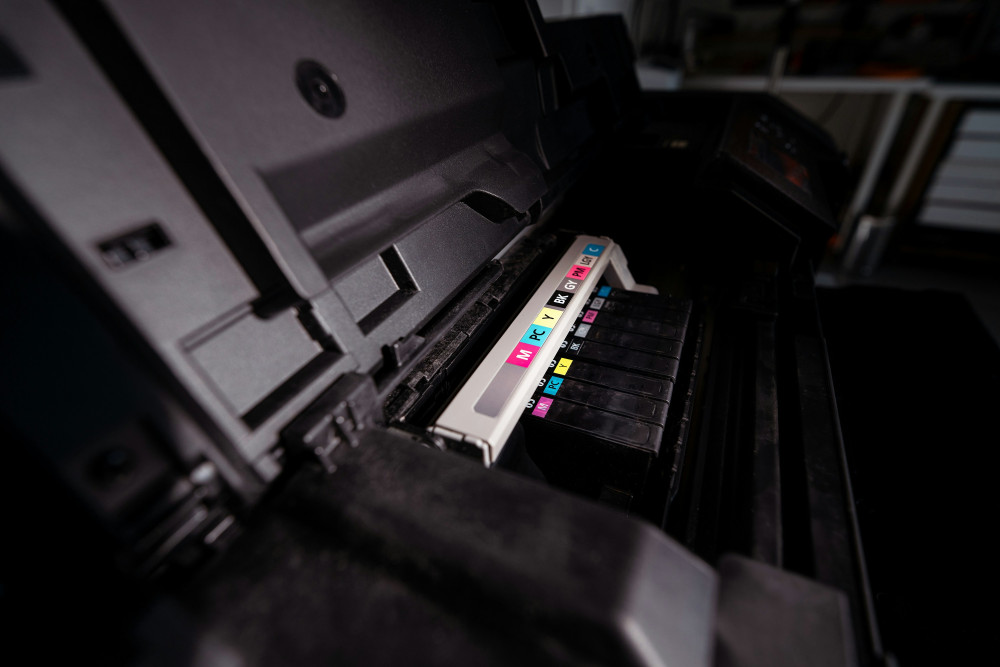
Ink cartridges – choose the right one for your equipment
Get control of quality, compatibility and price before you buy
Companies
Companies
Ink cartridges
Printers
Office equipment
Consumables
Business
3 min
Ink cartridges affect both print quality and operating costs. In this article, you get an overview of types, brands and practical considerations, so you can choose the cartridges that best suit your printer and your needs.
Jacob Morris
Jacob
Morris
Printers – from laser to ink and thermal printing
Find the printer that matches your needs at the office or at home
Companies
Companies
Printer
Home office
Office equipment
Technology
Buying guide
7 min
Printers come in many varieties – from fast laser printers to colourful ink models and thermal label printers. Get an overview of the most important types, features and brands, so you can choose the printer that best suits your needs.
Claire Powell
Claire
Powell
Espresso machines – how to preserve the taste and quality
Turn your coffee break into a moment of true enjoyment
Companies
Companies
Espresso machine
Coffee
Buying guide
Home barista
Lifestyle
4 min
Espresso machines allow you to enjoy barista-quality coffee at home. Read about the key considerations before buying, the differences between machine types, and how to preserve the taste and quality in every single cup.
Oliver Kelly
Oliver
Kelly
See the range of waste bins for different needs
Make waste management easier and more hygienic in everyday life
Companies
Companies
Waste bin
Cleaning
Hygiene
Facility management
Waste sorting
5 min
Waste bins come in many sizes, materials and designs. Get an overview of the most important types, functions and brands so that you can choose the solution that best suits your company’s needs and hygiene requirements.
Ethan Cooper
Ethan
Cooper